Thursday, May 15, 2014

Extending JSDT: adding your own content assist

Extending the JSDT content assist is a  topic asked several times on stackoverflow(20738788, 20779899). As I needed it for the Eclipse EASE project, I decided to come up with a short tutorial.

Source code for this tutorial is available on googlecode as a single zip archive, as a Team Project Set or you can checkout the SVN projects directly. 

Step 1: Preparations

As we will have dependencies to JSDT you either need to check out the source code from gerrit or add JSDT to your target platform.

Step 2: Defining the extension point

Create a new Plug-in Project com.codeandme.jsdt.contentassist and add following dependencies:
  • org.eclipse.wst.jsdt.ui
  • org.eclipse.core.runtime
  • org.eclipse.jface.text
Afterwards create a new Extension for org.eclipse.wst.jsdt.ui.javaCompletionProposalComputer. Provide an ID and Name. The ID will be needed as reference to a category, the name will be displayed in Preferences/JavaScript/Editor/Content Assist/Advanced. Create a proposalCategory node and provide a nice icon for your category.


Create a second extension of the same type for our implementation. Again provide an ID. Create a javaCompletionProposalComputer subnode with a class and activate set to true. The categoryID consists of your plugin name followed by the category ID we provided earlier.


If you use a target definition containing JSDT plugins you might not be able to use the Plug-in Manifest Editor for creating these extensions. In that case you have to edit the xml code directly:

<?xml version="1.0" encoding="UTF-8"?>
<?eclipse version="3.4"?>
<plugin>
   <extension point="org.eclipse.wst.jsdt.ui.javaCompletionProposalComputer"
   id="codeandme_category"
   name="Code and me proposals">
   <proposalCategory/>
 </extension>

 <extension
       id="codeandme_proposal"
       point="org.eclipse.wst.jsdt.ui.javaCompletionProposalComputer">
   <javaCompletionProposalComputer
      class="com.codeandme.jsdt.contentassist.CustomCompletionProposalComputer"
      categoryId="com.codeandme.jsdt.contentassist.codeandme_category"
      activate="true">
   </javaCompletionProposalComputer>
 </extension>

</plugin>
Step 3: Proposal computer implementation

Now for the easy part:create a new class CustomCompletionProposalComputer with following content:

package com.codeandme.jsdt.contentassist;

import java.util.ArrayList;
import java.util.List;

import org.eclipse.core.runtime.IProgressMonitor;
import org.eclipse.jface.text.contentassist.CompletionProposal;
import org.eclipse.wst.jsdt.ui.text.java.ContentAssistInvocationContext;
import org.eclipse.wst.jsdt.ui.text.java.IJavaCompletionProposalComputer;

public class CustomCompletionProposalComputer implements IJavaCompletionProposalComputer {

 @Override
 public void sessionStarted() {
 }

 @Override
 public List computeCompletionProposals(ContentAssistInvocationContext context, IProgressMonitor monitor) {

  ArrayList<CompletionProposal> proposals = new ArrayList<CompletionProposal>();

  proposals.add(new CompletionProposal("codeandme.blogspot.com", context.getInvocationOffset(), 0, "codeandme.blogspot.com".length()));
  proposals.add(new CompletionProposal("<your proposal here>", context.getInvocationOffset(), 0, "<your proposal here>".length()));

  return proposals;
 }

 @Override
 public List computeContextInformation(ContentAssistInvocationContext context, IProgressMonitor monitor) {
  return null;
 }

 @Override
 public String getErrorMessage() {
  return null;
 }

 @Override
 public void sessionEnded() {
 }
}


CompletionProposals could contain more information like attached documentation or ContextInformation for variables and other dynamic content. See this post for some information on the Contextinformation.

Optional: Helper methods

Typically you would need to evaluate the last characters before the cursor position to filter your proposals. You also might be interested in the content of the current line left of the cursor position. Maybe these helper methods are of some interest:
 private static final Pattern LINE_DATA_PATTERN = Pattern.compile(".*?([^\\p{Alnum}]?)(\\p{Alnum}*)$");

 /**
  * Extract context relevant information from current line. The returned matcher locates the last alphanumeric word in the line and an optional non
  * alphanumeric character right before that word. result.group(1) contains the last non-alphanumeric token (eg a dot, brackets, arithmetic operators, ...),
  * result.group(2) contains the alphanumeric text. This text can be used to filter content assist proposals.
  * 
  * @param context
  *            content assist context
  * @return matcher containing content assist information
  * @throws BadLocationException
  */
 protected Matcher matchLastToken(final ContentAssistInvocationContext context) throws BadLocationException {
  String data = getCurrentLine(context);
  return LINE_DATA_PATTERN.matcher(data);
 }

 /**
  * Extract text from current line up to the cursor position
  * 
  * @param context
  *            content assist context
  * @return current line data
  * @throws BadLocationException
  */
 protected String getCurrentLine(final ContentAssistInvocationContext context) throws BadLocationException {
  IDocument document = context.getDocument();
  int lineNumber = document.getLineOfOffset(context.getInvocationOffset());
  IRegion lineInformation = document.getLineInformation(lineNumber);

  return document.get(lineInformation.getOffset(), context.getInvocationOffset() - lineInformation.getOffset());
 }

Monday, December 9, 2013

From XML data to an EMF model

Recently I had to implement a large XML data storage into my RCP application. There was no schema available and the data was structured in some awkward way. Still the xml structure needed to be preserved as other tools depend on the data format. As I was playing around with EMF for a long time without actually getting serious on it I thought: "well, wouldn't it be nice if EMF could handle all the XML parsing/writing stuff".

Source code for this tutorial is available on googlecode as a single zip archive, as a Team Project Set or you can checkout the SVN projects directly.

Prerequisites

We need some XML example data to work on. So I chose a small storage for CDs:
<?xml version="1.0" encoding="UTF-8"?>
<collection>
 <disc title="The wall">
  <artist>Pink Floyd</artist>
  <track pos="1">In the flesh</track>
  <track pos="2">The thin ice</track>
  <track pos="3">Another brick in the wall</track>
 </disc>
 <disc title="Christmas compilation">
  <track pos="1">Last Christmas<artist>WHAM</artist></track>
  <track pos="2">Driving home for Christmas<artist>Chris Rea</artist></track>
 </disc>
</collection>

Step 1: Creating a schema

EMF is capable of creating a model from an existing schema. As we do not have one yet, we need to create it. Fortunately we need not to do this on our own. For this tutorial we will use an online converter, alternatively you could use xsd.exe from the Microsoft Windows SDK for .NET Framework 4 if you prefer a local tool.

Your schema.xsd should look like this:
<xs:schema attributeFormDefault="unqualified" elementFormDefault="qualified" xmlns:xs="http://www.w3.org/2001/XMLSchema">
  <xs:element name="collection">
    <xs:complexType>
      <xs:sequence>
        <xs:element name="disc" maxOccurs="unbounded" minOccurs="0">
          <xs:complexType>
            <xs:sequence>
              <xs:element type="xs:string" name="artist" minOccurs="0"/>
              <xs:element name="track" maxOccurs="unbounded" minOccurs="0">
                <xs:complexType mixed="true">
                  <xs:sequence>
                    <xs:element type="xs:string" name="artist" minOccurs="0"/>
                  </xs:sequence>
                  <xs:attribute type="xs:byte" name="pos" use="optional"/>
                </xs:complexType>
              </xs:element>
            </xs:sequence>
            <xs:attribute type="xs:string" name="title" use="optional"/>
          </xs:complexType>
        </xs:element>
      </xs:sequence>
    </xs:complexType>
  </xs:element>
</xs:schema>

A generated schema might need some tweaking here and there. Eclipse offers a nice visual schema editor for this purpose. Just make sure you do not alter the scheme too much. Your sample data still needs to be valid. To verify this, select your xml and xsd file and select Validate from the context menu.

Step 2: Create a model

Before we can create a model, we need to install some additional components. Pretending you started with a vanilla Eclipse for RCP Developers you additionally need to install EMF - Eclipse Modeling Framework SDK. Furthermore install the XSD Ecore Converter (uncheck Group items by category to find it).

You already should have a Plug-in project to store your files to. Now create a new EMF Generator Model. Name it Catalog.genmodel and select XML Schema for the model import.

On the next page select the schema.xsd file for the model input.

Finally rename the file from Schema.ecore to Catalog.ecore. You will end up not only with a Catalog.genmodel, but also with a Catalog.ecore file.

Step 3: Adapting the model

Looking at the ecore model we can see that all elements contain an ExtendedMetaData annotation. They are responsible for storing the XML representation of the model elements. This allows us to rename model classes and attributes without breaking XML import/export. Eg. we could get rid of the Type extension that was added to all EClasses.

Step 4: Using the model

Now that we have a model, we may generate code from the genmodel just as we would do for any other model: open the genmodel and select Generate All from the context menu of the Catalog node. Run your application, copy over your xml data, rename the data file to something.scheme and open it in the generated editor.
 To load the model from source you may use following snippet:
  SchemaPackageImpl.eINSTANCE.eClass();

  Resource resource = new ResourceSetImpl().getResource(URI.createFileURI("C:\\your\\path\\Sample data.schema"), true);

  EObject root = resource.getContents().get(0);
  if (root instanceof DocumentRoot) {
   for (Disc disc : ((DocumentRoot) root).getCollection().getDisc())
    System.out.println(disc.getTitle());
  }

Friday, November 22, 2013

Debugger 12: Memory display

To conclude our sessions on debuggers we will add a memory view to our example. These views typically show a dedicated memory range in an arbitrary format. You are not bound to the typical hex view style, still this is what we will use in this tutorial.

Debug Framework Tutorials

For a list of all debug related tutorials see Debug Framework Tutorials Overview.

Source code for this tutorial is available on github as a single zip archive, as a Team Project Set or you can browse the files online.

Step 1: Implementing Memory representations

As seen in the previous tutorial variables are bound to a StackFrame. Memory dumps instead are bound to the entire DebugTarget. This makes sense as variables may be valid within a dedicated scope only while the memory is a global resource valid for the whole process.

Technically speaking our interpreter does not support a memory as such. Therefore we fake it by copying "executed code" into the simulated memory.

Lets start with the TextMemoryBlock representation:
The main ingredients are a start address, a length, and the content itself. As before with variables we update the content on demand only when the dirty flag is set.

When the debug framework wants to display a dedicated memory area, it queries the TextDebugTarget:
public class TextDebugTarget extends TextDebugElement implements IDebugTarget, IEventProcessor {

 private List<TextMemoryBlock> fMemoryBlocks = new ArrayList<>();

 // ************************************************************
 // IMemoryBlockRetrieval
 // ************************************************************

 @Override
 public boolean supportsStorageRetrieval() {
  return true;
 }

 @Override
 public IMemoryBlock getMemoryBlock(final long startAddress, final long length) throws DebugException {
  TextMemoryBlock memoryBlock = new TextMemoryBlock(this, startAddress, length);
  fMemoryBlocks.add(memoryBlock);
  memoryBlock.fireCreationEvent();

  return memoryBlock;
 }
}
A new TextMemoryBlock is automatically marked dirty. Therefore it triggers an update event once its content is fetched. Once processed by the debugger we get a refresh event for the memory content in question, which gets handled by the TextDebugTarget.

As memory content will typically change during execution we need to invalidate old TextMemoryBlocks by setting them dirty on each suspend event handled by the TextDebugTarget:
public class TextDebugTarget extends TextDebugElement implements IDebugTarget, IEventProcessor {

 @Override
 public void handleEvent(final IDebugEvent event) {

   [...]

   } else if (event instanceof SuspendedEvent) {
    // debugger got started and waits in suspended mode
    setState(State.SUSPENDED);

    getThreads()[0].getTopStackFrame().setLineNumber(((SuspendedEvent) event).getLineNumber());
    getThreads()[0].getTopStackFrame().fireChangeEvent(DebugEvent.CONTENT);

    // mark memory regions as dirty
    for (TextMemoryBlock memory: fMemoryBlocks)
     memory.setDirty();
    
    // inform eclipse of suspended state
    getThreads()[0].fireSuspendEvent(DebugEvent.BREAKPOINT);
    

   } else if (event instanceof MemoryEvent) {
    int startAddress = ((MemoryEvent) event).getStartAddress();
    for (TextMemoryBlock block : fMemoryBlocks) {
     if ((startAddress >= block.getStartAddress()) && (startAddress < block.getEndAddress())) {
      // block affected
      block.update(startAddress, ((MemoryEvent) event).getData());
      block.fireChangeEvent(DebugEvent.CONTENT);
     }
    }
   }
  }
 }
}

Step 2: Registering a rendering

To register a memory block for rendering we need to add a new extension to our plugin.xml.
Add a new renderingBindings item to org.eclipse.debug.ui.memoryRenderings. You need to provide a primaryId for the default rendering to be used. The Browse... button will show a nice overview of available renderings.

If you want to support multiple renderings you may add them to the list of renderingIds. In addition you may add an enablement to the rendering that checks for instanceof(TextMemoryBlock).

Defining your own renderings is beyond the scope of this tutorial but may be implemented using the same extension point.

Step 3: Using the Memory view

First you have to activate the Debug / Memory view. After the debugger suspends for the first time, you may add memory areas to monitor. For a selected area the primary rendering is used by default. New Renderings... allows to open additional ones.

Thursday, November 21, 2013

Debugger 9: Variables support

Lets continue our little debugger example by adding support to display variables.

Debug Framework Tutorials

For a list of all debug related tutorials see Debug Framework Tutorials Overview.

Source code for this tutorial is available on github as a single zip archive, as a Team Project Set or you can browse the files online.

Step 1: Implementing variable classes

Variables are attached to StackFrames and will only be queried when the debugger is in suspended state. To implement them, we need a variable description stored in TextVariable:
public class TextVariable extends TextDebugElement implements IVariable {

 private final String fName;
 private IValue fValue;

 protected TextVariable(IDebugTarget target, String name, String value) {
  super(target);
  fName = name;
  setValue(value);
 }

 @Override
 public void setValue(String expression) {
  fValue = new TextValue(getDebugTarget(), expression);
 }

 @Override
 public boolean supportsValueModification() {
  return false;
 }

 @Override
 public IValue getValue() {
  return fValue;
 }

 @Override
 public String getName() {
  return fName;
 }

 @Override
 public String getReferenceTypeName() throws DebugException {
  return "text type";
 }
}
The implementation is straight forward and does not allow to modify the variable content.

An actual value is stored in the TextValue class:
public class TextValue extends TextDebugElement implements IValue {

 private final String fValue;

 public TextValue(IDebugTarget target, String value) {
  super(target);

  fValue = value;
 }

 @Override
 public String getReferenceTypeName() throws DebugException {
  return "text type";
 }

 @Override
 public String getValueString() throws DebugException {
  return fValue;
 }

 @Override
 public IVariable[] getVariables() throws DebugException {
  return new IVariable[0];
 }

 @Override
 public boolean hasVariables() throws DebugException {
  return false;
 }
}
To display hierarchical structures a value might hold child variables (eg. fields of a class, elements of a collection, ...). In that case you need to implement hasVariables() and getVariables() too.

You might have noticed that both classes define a method getReferenceTypeName(). While TextVariable.getReferenceTypeName() denotes the declared variable type, TextValue.getReferenceTypeName() denotes the actual type. Looking at a java example
IValue value = new TextValue();
The declared type would be IValue, while the actual type would be TextValue. You may enable these columns in the debug view by opening the Variables view menu and selecting Layout / Select Columns...

Step 2: Updating variables

Now for the big question: "how and when to update variables".

First we notice that variables are queried by the debug framework when a StackFrame element is selected that is in suspended mode. As we should do all our debugger queries in asynchronous mode we have two options:
  1. populate all stack frames automatically with variables on a suspend event in case our user might query them
  2. first deliver outdated/no data and update them as fast as possible
For the demo I chose the second option: we display whatever variables we had stored on the last query and trigger an asynchronous update.
public class TextStackFrame extends TextDebugElement implements IStackFrame {

 private final List<TextVariable> fVariables = new ArrayList<TextVariable>();
 private boolean fDirtyVariables = true;

 @Override
 public synchronized IVariable[] getVariables() {
  if (fDirtyVariables) {
   fDirtyVariables = false;
   getDebugTarget().fireModelEvent(new FetchVariablesRequest());
  }

  return fVariables.toArray(new IVariable[fVariables.size()]);
 }

 public synchronized void setVariables(Map<String, String> variables) {
  for (String name : variables.keySet()) {
   boolean processed = false;
   // try to find existing variable
   for (TextVariable variable : fVariables) {
    if (variable.getName().equals(name)) {
     variable.setValue(variables.get(name));
     variable.fireChangeEvent(DebugEvent.CONTENT);

     processed = true;
     break;
    }
   }

   if (!processed) {
    // not found, create new variable
    TextVariable textVariable = new TextVariable(getDebugTarget(), name, variables.get(name));
    fVariables.add(textVariable);
    textVariable.fireCreationEvent();
   }
  }
 }

 @Override
 public synchronized void fireChangeEvent(int detail) {
  fDirtyVariables = true;

  super.fireChangeEvent(detail);
 }

 @Override
 public boolean hasVariables() {
  return getVariables().length > 0;
 }
}


The TextDebugger sends its list of variables as a new event to the TextDebugTarget, which simply delegates the call to the topmost StackFrame within its handleEvent() method. During the update we send either change events or creation events for the updated variables. Of course a real implementation should be more intelligent than the implemented version above and use intelligent comparisons and caching.

If you want changed contents to be highlighted you should implement IVariable.hasValueChanged(). An example implementation is provided in the source code on github.

 
UI problems

There is one behavior, I could not fix yet: Sometimes the Variables view remains empty when the debugger suspends. Pushing the view to back and bringing it to front again solves this issue. Not sure if this is a problem in my code or the debugger framework. See bug 528120 for details.

Wednesday, November 20, 2013

Debugger 8: Adding "Run to line" support

Dedicated Run to line support is quite easy to implement. Most parts are already provided by the debug framework, we only need to consume it in the right way.

Debug Framework Tutorials

For a list of all debug related tutorials see Debug Framework Tutorials Overview.

Source code for this tutorial is available on github as a single zip archive, as a Team Project Set or you can browse the files online.

Step 1: Implement editor support

To use the run to line functionality from the debug framework the source code editor needs to implement IRunToLineTarget.
package com.codeandme.textinterpreter.debugger;

public class RunToLineTarget implements IRunToLineTarget {

 @Override
 public void runToLine(IWorkbenchPart part, ISelection selection, ISuspendResume target) throws CoreException {
  if (target instanceof TextStackFrame) {
   IDebugTarget debugTarget = (IDebugTarget) ((IAdaptable) target).getAdapter(IDebugTarget.class);
   if (debugTarget instanceof TextDebugTarget) {
    IBreakpoint breakpoint = new TextRunToLineBreakpoint(((TextDebugTarget) debugTarget).getFile(), getLineNumber(selection));
    RunToLineHandler handler = new RunToLineHandler(debugTarget, target, breakpoint);
    handler.run(new NullProgressMonitor());
   }
  }
 }

 @Override
 public boolean canRunToLine(IWorkbenchPart part, ISelection selection, ISuspendResume target) {
  return (target instanceof TextStackFrame);
 }

 private static int getLineNumber(ISelection selection) {
  if (selection instanceof ITextSelection)
   // text selections are 0 based
   return ((ITextSelection) selection).getStartLine() + 1;

  return 0;
 }
}
On a runToLine() call we create a new TextRunToLineBreakpoint which the handler automatically activates. The only difference to a TextLineBreakpoint is that we set its PERSISTED flag to false.

Of course the default text editor does not implement IRunToLineTarget. Therefore we need an adapter similar to what we did for the UI breakpoint integration.

That is everything we need to code for the Run to line functionality. Easy, isn't it?

The debug framework implementation also honors the preferences setting Run/Debug / Skip breakpoints during a 'Run to Line' operation. To me it seems as the implementation might be slightly buggy though. As the demo interpreter is lightning fast, conventional breakpoints will not be disabled fast enough sometimes and might still trigger.

Step 2: Register UI integration

To add the action into the editor context menu we need to add a new org.eclipse.ui.popupMenus extension point. Add a viewerContribution to it with id set to "textEditor.editorActions" and targetID set to "#TextEditorContext". Now add the Run to line action as provided in the screenshot.

Tuesday, November 19, 2013

Debugger 7: Source lookup

Having stepping and breakpoint support is nice, but the user needs some visual feedback where the debugger currently suspended. The source code should be opened in an editor and the current line should be highlighted.

The debug framework comes with a dedicated solution that looks for source files in dedicated project folders. If you have a project setup where you define source lookup folders this is the way to go for you. Another option is to implement source lookup completely from scratch. In our case the latter option is the easier one.

Debug Framework Tutorials

For a list of all debug related tutorials see Debug Framework Tutorials Overview.

Source code for this tutorial is available on github as a single zip archive, as a Team Project Set or you can browse the files online.

Step 1: The big picture

When a debug thread starts processing, it typically calls files, methods and functions. Such elements denote the call stack. The debugger framework uses this stack to resolve the current location within the source code. Each stack element may have a dedicated source location (editor content + selection within editor) attached to it.

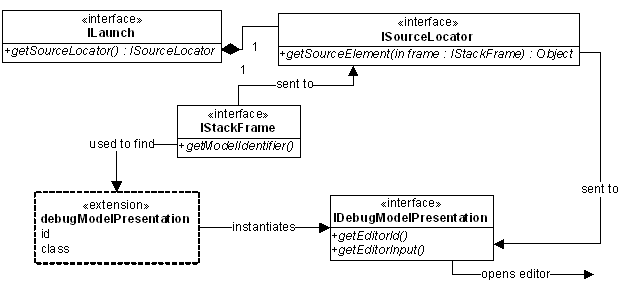
An ISourceLocator is attached to a launch extension, typically by using the org.eclipse.debug.core.sourceLocators extension point. This locator converts an IStackFrame to a source element by means of getSourceElement(IStackFrame stackFrame). This element is used to retrieve an IEditorInput and an editorID from the debug model. Now an editor can be opened. The line selection is retrieved from the stack frame.


Step 2: Adding StackFrames

The IStackFrame implementation we use is really simple: we only allow to store the current line number and to retrieve the source file. As we have only one source file available, we store it directly within our debug target.

Create a new class TextStackFrame:
public class TextStackFrame extends TextDebugElement implements IStackFrame {

 private final IThread fThread;
 private int fLineNumber = 1;

 public TextStackFrame(IDebugTarget target, IThread thread) {
  super(target);
  fThread = thread;
 }

 @Override
 public IThread getThread() {
  return fThread;
 }

 @Override
 public int getLineNumber() {
  return fLineNumber;
 }

 @Override
 public int getCharStart() {
  return -1;
 }

 @Override
 public int getCharEnd() {
  return -1;
 }

 @Override
 public String getName() {
  return getSourceFile().getName() + ", line " + getLineNumber();
 }

 public void setLineNumber(int lineNumber) {
  fLineNumber = lineNumber;
 }

 public IFile getSourceFile() {
  return (getDebugTarget()).getFile();
 }
}
For a line oriented language getLineNumber() is important as it is used for the line marker when our code is suspended. Make sure both getCharStart() and getCharEnd() return -1 in that case. If you want to mark a section within a line, implement getCharStart() and getCharEnd().

As we do not have multiple source files, function calls or similar things we can stick to one static StackFrame for the whole debugging session. It is registered and updated from the TextDebugTarget:
public class TextDebugTarget extends TextDebugElement implements IDebugTarget, IEventProcessor {

 @Override
 public void handleEvent(final IDebugEvent event) {

  if (!isDisconnected()) {

   if (event instanceof DebuggerStartedEvent) {

    [...]

    // create stack frame
    TextStackFrame stackFrame = new TextStackFrame(this, thread);
    thread.addStackFrame(stackFrame);
    stackFrame.fireCreationEvent();

   } else if (event instanceof SuspendedEvent) {
    // debugger got started and waits in suspended mode
    setState(State.SUSPENDED);

    getThreads()[0].getTopStackFrame().setLineNumber(((SuspendedEvent) event).getLineNumber());
    getThreads()[0].getTopStackFrame().fireChangeEvent(DebugEvent.CONTENT);

    // inform eclipse of suspended state
    fireSuspendEvent(DebugEvent.CLIENT_REQUEST);
   }

   [...]

  }
 }
}
It is important that the StackFrame is registered before the debug UI suspends for the first time. If this is not the case the Debug view will not fully expand all its nodes and therefore not display the suspended StackFrame and the according source file in the first place. A user would have to manually expand and select the StackFrame.

When executing you will now see a StackFrame child node for our thread, indicating the executed file and line number.

Step 3: Resolving source files

Resolving source elements is handled by a SourceLocator. We have to register a new one in com.codeandme.debugger.textinterpreter.debugger/plugin.xml:

The implementation of TextSourceLocator is straight forward, we only need to deal with getSourceElement():
public class TextSourceLocator implements IPersistableSourceLocator {

 @Override
 public Object getSourceElement(IStackFrame stackFrame) {
  if (stackFrame instanceof TextStackFrame)
   return ((TextStackFrame) stackFrame).getSourceFile();

  return null;
 }
}
Having  a source locator we now may register it to the launch configuration. Open com.codeandme.debugger.textinterpreter.ui/plugin.xml, navigate to the Text Interpreter launchConfigurationType and set sourceLocatorId to com.codeandme.debugger.textinterpreter.debugger.sourceLocator.

Step 4: Adding editor support

The final step is to define the editor to be used. This is handled by TextDebugModelPresentation:
public class TextDebugModelPresentation implements IDebugModelPresentation {

 @Override
 public IEditorInput getEditorInput(Object element) {
  if (element instanceof IFile)
   return new FileEditorInput((IFile) element);

  return null;
 }

 @Override
 public String getEditorId(IEditorInput input, Object element) {
  if (element instanceof IFile)
   return PlatformUI.getWorkbench().getEditorRegistry().getDefaultEditor(((IFile) element).getName()).getId();

  return null;
 }
}
Using the default editor for the source file is a good choice as it is up to the user to define a dedicated editor. We might add some fallback code to open the default text editor instead of returning null in an error case.

Code lookup should work by now. Give it a try and step through some sample scripts.

Monday, November 18, 2013

Debugger 6: Debugger breakpoint integration

After we have breakpoints available in the UI we need to teach our debug model and debugger to use them.

Debug Framework Tutorials

For a list of all debug related tutorials see Debug Framework Tutorials Overview.

Source code for this tutorial is available on github as a single zip archive, as a Team Project Set or you can browse the files online.

Step 1: Adding breakpoint support to the model

Debuggers generally should suspend when a new source file is loaded. Then the model can attach breakpoints to the debugger and resume operation afterwards.

Additionally we need to listen for breakpoint changes to add new breakpoints to the debugger or to remove them when they get disabled or removed by the user.

Lets start with the listener implementation:
public class TextDebugTarget extends TextDebugElement implements IDebugTarget, IEventProcessor {

 @Override
 public boolean supportsBreakpoint(final IBreakpoint breakpoint) {
  if (fFile.equals(breakpoint.getMarker().getResource())) {
   // breakpoint on our source file
   return true;
  }

  return false;
 }

 private boolean isEnabledBreakpoint(IBreakpoint breakpoint) {
  try {
   return breakpoint.isEnabled() && DebugPlugin.getDefault().getBreakpointManager().isEnabled();
  } catch (CoreException e) {
   // ignore invalid breakpoint
  }

  return false;
 }

 // ************************************************************
 // IBreakpointListener
 // ************************************************************

 @Override
 public void breakpointAdded(final IBreakpoint breakpoint) {
  if ((supportsBreakpoint(breakpoint)) && (isEnabledBreakpoint(breakpoint)))
   fireModelEvent(new BreakpointRequest(breakpoint, BreakpointRequest.ADDED));
 }

 @Override
 public void breakpointRemoved(final IBreakpoint breakpoint, final IMarkerDelta delta) {
  if (supportsBreakpoint(breakpoint))
   fireModelEvent(new BreakpointRequest(breakpoint, BreakpointRequest.REMOVED));
 }

 @Override
 public void breakpointChanged(final IBreakpoint breakpoint, final IMarkerDelta delta) {
  breakpointRemoved(breakpoint, delta);
  breakpointAdded(breakpoint);
 }
}
As breakpoints might be targeting non relevant source files or even other target languages we need to verify that a breakpoint is related to our source file. If yes, we send an adequate event to our debugger.

While there are no further checks for a breakpoint removal, we only add active breakpoints. There exist two separate enablements we need to verify: the breakpoint itself can be disabled and/or the BreakpointManager can be disabled globally.

Next we need to take care that we track breakpoint changes accordingly by subscribing to the BreakpointManager.
public class TextDebugTarget extends TextDebugElement implements IDebugTarget, IEventProcessor {

 @Override
 public void handleEvent(final IDebugEvent event) {

  if (!isDisconnected()) {
   if (event instanceof DebuggerStartedEvent) {
    // create debug thread
    TextThread thread = new TextThread(this);
    fThreads.add(thread);
    thread.fireCreationEvent();

    // debugger got started and waits in suspended mode
    setState(State.SUSPENDED);

    // add breakpoint listener
    DebugPlugin.getDefault().getBreakpointManager().addBreakpointListener(this);

    // attach deferred breakpoints to debugger
    IBreakpoint[] breakpoints = DebugPlugin.getDefault().getBreakpointManager().getBreakpoints(getModelIdentifier());
    for (IBreakpoint breakpoint : breakpoints)
     breakpointAdded(breakpoint);

    // inform eclipse of suspended state
    fireSuspendEvent(DebugEvent.CLIENT_REQUEST);

   } else if (event instanceof TerminatedEvent) {
    // debugger is terminated
    setState(State.TERMINATED);

     // unregister breakpoint listener
     DebugPlugin.getDefault().getBreakpointManager().removeBreakpointListener(this);

    // we do not need our dispatcher anymore
    fDispatcher.terminate();

    // inform eclipse of terminated state
    fireTerminateEvent();
   }
  }
 }
}
On a DebuggerStartedEvent we need to set all relevant breakpoints. If we stay suspended or immediately call resume() is a matter of taste.

Step 2: Adding breakpoint support to the debugger

The debugger needs to cache breakpoints and check them on a line change event. In our case we will simply track line numbers where we want to suspend:
public class TextDebugger implements IDebugger, IEventProcessor {

 private final Collection<Integer> fBreakpoints = new HashSet<>();

 @Override
 public boolean isBreakpoint(final int lineNumber) {
  if (fBreakpoints.contains(lineNumber))
   return true;

  return fIsStepping;
 }

 @Override
 public void handleEvent(final IDebugEvent event) {

  [...]

  } else if (event instanceof BreakpointRequest) {
   int line = ((BreakpointRequest) event).getBreakpoint().getMarker().getAttribute(IMarker.LINE_NUMBER, -1);
   if (line != -1) {
    if (((BreakpointRequest) event).getType() == BreakpointRequest.ADDED)
     fBreakpoints.add(line);

    else if (((BreakpointRequest) event).getType() == BreakpointRequest.REMOVED)
     fBreakpoints.remove(line);
   }
  }
 }
}

Breakpoints are stored for a dedicated IDebugModelPresentation. We introduced one in the previous tutorial. Now we need to let TextDebugElement.getModelIdentifier() refer to this ID. If you do not set this identifier, you will not be able to find any breakpoints.

The mechanisms for setting and caching breakpoints might get a bit more complicated for a real world solution as you might support different kinds of breakpoints like function breakpoints or watchpoints.