Showing posts with label RCP. Show all posts

Thursday, December 14, 2017

Debugger 11: Watch expressions

Now that we have variables working, we might also want to include watch expressions to dynamically inspect code fragments.

Debug Framework Tutorials

For a list of all debug related tutorials see Debug Framework Tutorials Overview.

Source code for this tutorial is available on github as a single zip archive, as a Team Project Set or you can browse the files online.

Step 1: Provide the Watch Expression Delegate

Watch points are implemented via an extension point. So switch to your plugin.xml and add a new extension point for org.eclipse.debug.core.watchExpressionDelegates.
The new delegate simply points to our debugModel identifier: com.codeandme.debugModelPresentation.textinterpreter and provides a class implementation:
public class TextWatchExpressionDelegate implements IWatchExpressionDelegate {

 @Override
 public void evaluateExpression(String expression, IDebugElement context, IWatchExpressionListener listener) {
  if (context instanceof TextStackFrame)
   ((TextStackFrame) context).getDebugTarget().fireModelEvent(new EvaluateExpressionRequest(expression, listener));
 }
}
Delegates can decide on which context they may operate. For our interpreter we could evaluate expressions on StackFrames, Threads or the Process, but typically evaluations do take place on a dedicated StackFrame.

Step 2: Evaluation

Now we apply the usual pattern: send an event, let the debugger process it and send some event back to the debug target. Once the evaluation is done we then will inform the provided listener of the outcome of the evaluation.
public class TextDebugTarget extends TextDebugElement implements IDebugTarget, IEventProcessor {

 @Override
 public void handleEvent(final IDebugEvent event) {

   [...]

   } else if (event instanceof EvaluateExpressionResult) {
    IWatchExpressionListener listener = ((EvaluateExpressionResult) event).getOriginalRequest().getListener();
    TextWatchExpressionResult result = new TextWatchExpressionResult((EvaluateExpressionResult)event, this);
    listener.watchEvaluationFinished(result);    
   }
 }
The TextWatchExpressionResult uses a TextValue to represent the evaluation result. As before with variables we may support nested child variables within the value. In case the evaluation failed for some reason we may provide error messages which do get displayed in the Expressions view.

Debugger 10: Editing variables

In the previous tutorial we introduced variables support for our debugger. Now lets see how we can modify variables dynamically during a debug session.

Debug Framework Tutorials

For a list of all debug related tutorials see Debug Framework Tutorials Overview.

Source code for this tutorial is available on github as a single zip archive, as a Team Project Set or you can browse the files online.

Step 1: Allowing for editing and trigger update

First variables need to support editing. Then the variables view will automatically provide a text input box on the value field once clicked by the user. This is also a limitation: editing variables requires the framework to interpret an input string and process it accordingly to the target language.

The relevant changes for the TextVariable class are shown below:
public class TextVariable extends TextDebugElement implements IVariable {

 @Override
 public void setValue(String expression) {
  getDebugTarget().fireModelEvent(new ChangeVariableRequest(getName(), expression));
 }

 @Override
 public boolean supportsValueModification() {
  return true;
 }

 @Override
 public boolean verifyValue(String expression) throws DebugException {
  return true;
 }
}
verifyValue(String) and setValue(String) are used by the debug framework when a user tries to edit a variable in the UI. We do not need to update the value yet, but simply trigger an event to update the variable in the debugger.

Step 2: Variable update & refresh

As our primitive interpreter accepts any kind of text variables there is nothing which can go wrong here. Instead of sending an update event for the changed variable we simply use the already existing VariablesEvent to force a refresh of all variables of the current TextStackFrame:
public class TextDebugger implements IDebugger, IEventProcessor {

 @Override
 public void handleEvent(final IDebugEvent event) {

  [...]

  } else if (event instanceof ChangeVariableRequest) {
   fInterpreter.getVariables().put(((ChangeVariableRequest) event).getName(), ((ChangeVariableRequest) event).getContent());
   fireEvent(new VariablesEvent(fInterpreter.getVariables()));
  }
 }
}

Friday, July 24, 2015

A custom search provider

In this tutorial we will implement a custom search for your RCP. Therefore we will first create the search logic and add UI components in a second step.
I found few resources on search functionality, here are some from the Eclipse FAQs:
To have something to search for we will look for files on the local file system. So this is our target for today:
 

Source code for this tutorial is available on github as a single zip archive, as a Team Project Set or you can browse the files online.

Step 1: Search Results


First create a new Plug-in Project and create a class FileSearchResult that implements ISearchResult. Therefore you need a dependency to org.eclipse.search.
package com.codeandme.searchprovider;

import java.io.File;
import java.util.Collection;
import java.util.HashSet;

import org.eclipse.core.runtime.ListenerList;
import org.eclipse.jface.resource.ImageDescriptor;
import org.eclipse.search.ui.ISearchQuery;
import org.eclipse.search.ui.ISearchResult;
import org.eclipse.search.ui.ISearchResultListener;
import org.eclipse.search.ui.SearchResultEvent;

public class FileSearchResult implements ISearchResult {

 private final ISearchQuery fQuery;
 private final ListenerList fListeners = new ListenerList();

 private final Collection<File> fResult = new HashSet<File>();

 public FileSearchResult(ISearchQuery query) {
  fQuery = query;
 }

 @Override
 public String getLabel() {
  return fResult.size() + " file(s) found";
 }

 @Override
 public String getTooltip() {
  return "Found files in the filesystem";
 }

 @Override
 public ImageDescriptor getImageDescriptor() {
  return null;
 }

 @Override
 public ISearchQuery getQuery() {
  return fQuery;
 }

 @Override
 public void addListener(ISearchResultListener l) {
  fListeners.add(l);
 }

 @Override
 public void removeListener(ISearchResultListener l) {
  fListeners.remove(l);
 }

 private void notifyListeners(File file) {
  SearchResultEvent event = new FileSearchResultEvent(this, file);

  for (Object listener : fListeners.getListeners())
   ((ISearchResultListener) listener).searchResultChanged(event);
 }

 public void addFile(File file) {
  fResult.add(file);
  notifyListeners(file);
 }
}
Nothing special here, we will use addFile() later in this tutorial to add more and more files to our result set. Whenever the result changes, we need to inform interested listeners. So lets see how FileSearchResultEvent looks like:
package com.codeandme.searchprovider;

import java.io.File;

import org.eclipse.search.ui.ISearchResult;
import org.eclipse.search.ui.SearchResultEvent;

public class FileSearchResultEvent extends SearchResultEvent {

 private final File fAddedFile;

 protected FileSearchResultEvent(ISearchResult searchResult, File addedFile) {
  super(searchResult);
  fAddedFile = addedFile;
 }

 public File getAddedFile() {
  return fAddedFile;
 }
}
Even simpler! To update results incrementally we hold a reference to the added file.

Step 2: The search query

The main logic for a search is implemented as an ISearchQuery. It has 2 jobs: do the actual search and populate the search result.
package com.codeandme.searchprovider;

import java.io.File;
import java.io.FileFilter;
import java.util.Collection;
import java.util.HashSet;

import org.eclipse.core.runtime.IProgressMonitor;
import org.eclipse.core.runtime.IStatus;
import org.eclipse.core.runtime.OperationCanceledException;
import org.eclipse.core.runtime.Status;
import org.eclipse.search.ui.ISearchQuery;
import org.eclipse.search.ui.ISearchResult;

public class FileSearchQuery implements ISearchQuery {

 private final File fRoot;
 private final String fFilter;
 private final boolean fRecursive;

 private final FileSearchResult fSearchResult;

 public FileSearchQuery(String root, String filter, boolean recursive) {
  fRoot = (root.isEmpty()) ? File.listRoots()[0] : new File(root);
  fFilter = filter;
  fRecursive = recursive;
  fSearchResult = new FileSearchResult(this);
 }

 @Override
 public IStatus run(IProgressMonitor monitor) throws OperationCanceledException {
  Collection<File> entries = new HashSet<File>();
  entries.add(fRoot);

  do {
   File entry = entries.iterator().next();
   entries.remove(entry);

   entry.listFiles(new FileFilter() {

    @Override
    public boolean accept(File pathname) {
     if ((pathname.isFile()) && (pathname.getName().contains(fFilter))) {
      // accept file
      fSearchResult.addFile(pathname);

      return true;
     }

     if ((pathname.isDirectory()) && (fRecursive))
      entries.add(pathname);

     return false;
    }
   });

  } while (!entries.isEmpty());

  return Status.OK_STATUS;
 }

 @Override
 public String getLabel() {
  return "Filesystem search";
 }

 @Override
 public boolean canRerun() {
  return true;
 }

 @Override
 public boolean canRunInBackground() {
  return true;
 }

 @Override
 public ISearchResult getSearchResult() {
  return fSearchResult;
 }
}
Our query needs 3 parameters:
  • a root object
  • a file name filter
  • a recursive flag to scan subfolders
In the constructor we create the FileSearchResult and link it to our query. Then we traverse folders and add file by file to our search result. We do not check our input parameters very thoroughly for the sake of simplicity.

The logic is implemented, now lets add some nice UI elements.

Step 3: Search Dialog

To add a new search page to the search dialog (main menu/Search/Search...) we use the extension point org.eclipse.search.searchPages.
 
Just provide id, label and a class reference to:
package com.codeandme.searchprovider.ui;

import org.eclipse.jface.dialogs.DialogPage;
import org.eclipse.search.ui.ISearchPage;
import org.eclipse.search.ui.ISearchPageContainer;
import org.eclipse.search.ui.NewSearchUI;
import org.eclipse.swt.SWT;
import org.eclipse.swt.widgets.Composite;

import com.codeandme.searchprovider.FileSearchQuery;

public class FileSearchPage extends DialogPage implements ISearchPage {

 private ISearchPageContainer fContainer;

 @Override
 public boolean performAction() {
  FileSearchQuery searchQuery = new FileSearchQuery("/home", "txt", true);
  NewSearchUI.runQueryInForeground(fContainer.getRunnableContext(), searchQuery);

  return true;
 }

 @Override
 public void setContainer(ISearchPageContainer container) {
  fContainer = container;
 }

 @Override
 public void createControl(Composite parent) {
  Composite root = new Composite(parent, SWT.NULL);

  [...]

  // need to set the root element
  setControl(root);
 }
}
I have removed the UI code from createControl() as it is not relevant here. If interested you can find it on github. The only important thing here is to set the root control using setControl().

performAction() starts the actual search. Therefore we create a query and run it either as foreground or as background job. By returning true we indicate that the search dialog shall be closed.

Step 4: Display search results

To add a new page to the Search View we need another extension point: org.eclipse.search.searchResultViewPages.

Add a new viewPage with an id and label. To link this page with search results of a certain kind we provide the class of search results this page can display. Set it to our FileSearchResult type. Finally we provide a class implementation for the page:
package com.codeandme.searchprovider.ui;

import org.eclipse.search.ui.ISearchResult;
import org.eclipse.search.ui.ISearchResultListener;
import org.eclipse.search.ui.ISearchResultPage;
import org.eclipse.search.ui.ISearchResultViewPart;
import org.eclipse.search.ui.SearchResultEvent;
import org.eclipse.swt.SWT;
import org.eclipse.swt.layout.FillLayout;
import org.eclipse.swt.widgets.Composite;
import org.eclipse.swt.widgets.Control;
import org.eclipse.swt.widgets.Display;
import org.eclipse.swt.widgets.Text;
import org.eclipse.ui.IActionBars;
import org.eclipse.ui.IMemento;
import org.eclipse.ui.PartInitException;
import org.eclipse.ui.part.IPageSite;

import com.codeandme.searchprovider.FileSearchResultEvent;

public class SearchResultPage implements ISearchResultPage, ISearchResultListener {

 private String fId;
 private Composite fRootControl;
 private IPageSite fSite;
 private Text ftext;

 @Override
 public Object getUIState() {
  return null;
 }

 @Override
 public void setInput(ISearchResult search, Object uiState) {
  search.addListener(this);
 }

 @Override
 public void setViewPart(ISearchResultViewPart part) {
 }

 @Override
 public void setID(String id) {
  fId = id;
 }

 @Override
 public String getID() {
  return fId;
 }

 @Override
 public String getLabel() {
  return "Filesystem Search Results";
 }

 @Override
 public IPageSite getSite() {
  return fSite;
 }

 @Override
 public void init(IPageSite site) throws PartInitException {
  fSite = site;
 }

 @Override
 public void createControl(Composite parent) {
  fRootControl = new Composite(parent, SWT.NULL);
  fRootControl.setLayout(new FillLayout(SWT.HORIZONTAL));

  ftext = new Text(fRootControl, SWT.BORDER | SWT.READ_ONLY | SWT.H_SCROLL | SWT.V_SCROLL | SWT.CANCEL | SWT.MULTI);
 }

 @Override
 public void dispose() {
  // nothing to do
 }

 @Override
 public Control getControl() {
  return fRootControl;
 }

 @Override
 public void setActionBars(IActionBars actionBars) {
 }

 @Override
 public void setFocus() {
  fRootControl.setFocus();
 }

 @Override
 public void restoreState(IMemento memento) {
  // nothing to do
 }

 @Override
 public void saveState(IMemento memento) {
  // nothing to do
 }

 @Override
 public void searchResultChanged(SearchResultEvent event) {
  if (event instanceof FileSearchResultEvent) {
   Display.getDefault().asyncExec(new Runnable() {
    @Override
    public void run() {
     String newText = ftext.getText() + "\n" + ((FileSearchResultEvent) event).getAddedFile().getAbsolutePath();
     ftext.setText(newText);
    }
   });
  }
 }
}
Lots of getters and setters, but nothing complicated. For this example we use a simple text control to add the names of found files. setInput() will be called by the framework to link this view with a search result. Now we attach a listeners to get notified on changes on the result.

I found one caveat while implementing: when your query code (from there we trigger searchResultChanged()) raises an exception, you do not get the output on the console as you might expect. Basically this means that your result page remains empty without any notification that something went wrong. Use the debugger to single step through your code in that case.

Monday, December 9, 2013

From XML data to an EMF model

Recently I had to implement a large XML data storage into my RCP application. There was no schema available and the data was structured in some awkward way. Still the xml structure needed to be preserved as other tools depend on the data format. As I was playing around with EMF for a long time without actually getting serious on it I thought: "well, wouldn't it be nice if EMF could handle all the XML parsing/writing stuff".

Source code for this tutorial is available on googlecode as a single zip archive, as a Team Project Set or you can checkout the SVN projects directly.

Prerequisites

We need some XML example data to work on. So I chose a small storage for CDs:
<?xml version="1.0" encoding="UTF-8"?>
<collection>
 <disc title="The wall">
  <artist>Pink Floyd</artist>
  <track pos="1">In the flesh</track>
  <track pos="2">The thin ice</track>
  <track pos="3">Another brick in the wall</track>
 </disc>
 <disc title="Christmas compilation">
  <track pos="1">Last Christmas<artist>WHAM</artist></track>
  <track pos="2">Driving home for Christmas<artist>Chris Rea</artist></track>
 </disc>
</collection>

Step 1: Creating a schema

EMF is capable of creating a model from an existing schema. As we do not have one yet, we need to create it. Fortunately we need not to do this on our own. For this tutorial we will use an online converter, alternatively you could use xsd.exe from the Microsoft Windows SDK for .NET Framework 4 if you prefer a local tool.

Your schema.xsd should look like this:
<xs:schema attributeFormDefault="unqualified" elementFormDefault="qualified" xmlns:xs="http://www.w3.org/2001/XMLSchema">
  <xs:element name="collection">
    <xs:complexType>
      <xs:sequence>
        <xs:element name="disc" maxOccurs="unbounded" minOccurs="0">
          <xs:complexType>
            <xs:sequence>
              <xs:element type="xs:string" name="artist" minOccurs="0"/>
              <xs:element name="track" maxOccurs="unbounded" minOccurs="0">
                <xs:complexType mixed="true">
                  <xs:sequence>
                    <xs:element type="xs:string" name="artist" minOccurs="0"/>
                  </xs:sequence>
                  <xs:attribute type="xs:byte" name="pos" use="optional"/>
                </xs:complexType>
              </xs:element>
            </xs:sequence>
            <xs:attribute type="xs:string" name="title" use="optional"/>
          </xs:complexType>
        </xs:element>
      </xs:sequence>
    </xs:complexType>
  </xs:element>
</xs:schema>

A generated schema might need some tweaking here and there. Eclipse offers a nice visual schema editor for this purpose. Just make sure you do not alter the scheme too much. Your sample data still needs to be valid. To verify this, select your xml and xsd file and select Validate from the context menu.

Step 2: Create a model

Before we can create a model, we need to install some additional components. Pretending you started with a vanilla Eclipse for RCP Developers you additionally need to install EMF - Eclipse Modeling Framework SDK. Furthermore install the XSD Ecore Converter (uncheck Group items by category to find it).

You already should have a Plug-in project to store your files to. Now create a new EMF Generator Model. Name it Catalog.genmodel and select XML Schema for the model import.

On the next page select the schema.xsd file for the model input.

Finally rename the file from Schema.ecore to Catalog.ecore. You will end up not only with a Catalog.genmodel, but also with a Catalog.ecore file.

Step 3: Adapting the model

Looking at the ecore model we can see that all elements contain an ExtendedMetaData annotation. They are responsible for storing the XML representation of the model elements. This allows us to rename model classes and attributes without breaking XML import/export. Eg. we could get rid of the Type extension that was added to all EClasses.

Step 4: Using the model

Now that we have a model, we may generate code from the genmodel just as we would do for any other model: open the genmodel and select Generate All from the context menu of the Catalog node. Run your application, copy over your xml data, rename the data file to something.scheme and open it in the generated editor.
 To load the model from source you may use following snippet:
  SchemaPackageImpl.eINSTANCE.eClass();

  Resource resource = new ResourceSetImpl().getResource(URI.createFileURI("C:\\your\\path\\Sample data.schema"), true);

  EObject root = resource.getContents().get(0);
  if (root instanceof DocumentRoot) {
   for (Disc disc : ((DocumentRoot) root).getCollection().getDisc())
    System.out.println(disc.getTitle());
  }

Friday, November 22, 2013

Debugger 12: Memory display

To conclude our sessions on debuggers we will add a memory view to our example. These views typically show a dedicated memory range in an arbitrary format. You are not bound to the typical hex view style, still this is what we will use in this tutorial.

Debug Framework Tutorials

For a list of all debug related tutorials see Debug Framework Tutorials Overview.

Source code for this tutorial is available on github as a single zip archive, as a Team Project Set or you can browse the files online.

Step 1: Implementing Memory representations

As seen in the previous tutorial variables are bound to a StackFrame. Memory dumps instead are bound to the entire DebugTarget. This makes sense as variables may be valid within a dedicated scope only while the memory is a global resource valid for the whole process.

Technically speaking our interpreter does not support a memory as such. Therefore we fake it by copying "executed code" into the simulated memory.

Lets start with the TextMemoryBlock representation:
The main ingredients are a start address, a length, and the content itself. As before with variables we update the content on demand only when the dirty flag is set.

When the debug framework wants to display a dedicated memory area, it queries the TextDebugTarget:
public class TextDebugTarget extends TextDebugElement implements IDebugTarget, IEventProcessor {

 private List<TextMemoryBlock> fMemoryBlocks = new ArrayList<>();

 // ************************************************************
 // IMemoryBlockRetrieval
 // ************************************************************

 @Override
 public boolean supportsStorageRetrieval() {
  return true;
 }

 @Override
 public IMemoryBlock getMemoryBlock(final long startAddress, final long length) throws DebugException {
  TextMemoryBlock memoryBlock = new TextMemoryBlock(this, startAddress, length);
  fMemoryBlocks.add(memoryBlock);
  memoryBlock.fireCreationEvent();

  return memoryBlock;
 }
}
A new TextMemoryBlock is automatically marked dirty. Therefore it triggers an update event once its content is fetched. Once processed by the debugger we get a refresh event for the memory content in question, which gets handled by the TextDebugTarget.

As memory content will typically change during execution we need to invalidate old TextMemoryBlocks by setting them dirty on each suspend event handled by the TextDebugTarget:
public class TextDebugTarget extends TextDebugElement implements IDebugTarget, IEventProcessor {

 @Override
 public void handleEvent(final IDebugEvent event) {

   [...]

   } else if (event instanceof SuspendedEvent) {
    // debugger got started and waits in suspended mode
    setState(State.SUSPENDED);

    getThreads()[0].getTopStackFrame().setLineNumber(((SuspendedEvent) event).getLineNumber());
    getThreads()[0].getTopStackFrame().fireChangeEvent(DebugEvent.CONTENT);

    // mark memory regions as dirty
    for (TextMemoryBlock memory: fMemoryBlocks)
     memory.setDirty();
    
    // inform eclipse of suspended state
    getThreads()[0].fireSuspendEvent(DebugEvent.BREAKPOINT);
    

   } else if (event instanceof MemoryEvent) {
    int startAddress = ((MemoryEvent) event).getStartAddress();
    for (TextMemoryBlock block : fMemoryBlocks) {
     if ((startAddress >= block.getStartAddress()) && (startAddress < block.getEndAddress())) {
      // block affected
      block.update(startAddress, ((MemoryEvent) event).getData());
      block.fireChangeEvent(DebugEvent.CONTENT);
     }
    }
   }
  }
 }
}

Step 2: Registering a rendering

To register a memory block for rendering we need to add a new extension to our plugin.xml.
Add a new renderingBindings item to org.eclipse.debug.ui.memoryRenderings. You need to provide a primaryId for the default rendering to be used. The Browse... button will show a nice overview of available renderings.

If you want to support multiple renderings you may add them to the list of renderingIds. In addition you may add an enablement to the rendering that checks for instanceof(TextMemoryBlock).

Defining your own renderings is beyond the scope of this tutorial but may be implemented using the same extension point.

Step 3: Using the Memory view

First you have to activate the Debug / Memory view. After the debugger suspends for the first time, you may add memory areas to monitor. For a selected area the primary rendering is used by default. New Renderings... allows to open additional ones.

Thursday, November 21, 2013

Debugger 9: Variables support

Lets continue our little debugger example by adding support to display variables.

Debug Framework Tutorials

For a list of all debug related tutorials see Debug Framework Tutorials Overview.

Source code for this tutorial is available on github as a single zip archive, as a Team Project Set or you can browse the files online.

Step 1: Implementing variable classes

Variables are attached to StackFrames and will only be queried when the debugger is in suspended state. To implement them, we need a variable description stored in TextVariable:
public class TextVariable extends TextDebugElement implements IVariable {

 private final String fName;
 private IValue fValue;

 protected TextVariable(IDebugTarget target, String name, String value) {
  super(target);
  fName = name;
  setValue(value);
 }

 @Override
 public void setValue(String expression) {
  fValue = new TextValue(getDebugTarget(), expression);
 }

 @Override
 public boolean supportsValueModification() {
  return false;
 }

 @Override
 public IValue getValue() {
  return fValue;
 }

 @Override
 public String getName() {
  return fName;
 }

 @Override
 public String getReferenceTypeName() throws DebugException {
  return "text type";
 }
}
The implementation is straight forward and does not allow to modify the variable content.

An actual value is stored in the TextValue class:
public class TextValue extends TextDebugElement implements IValue {

 private final String fValue;

 public TextValue(IDebugTarget target, String value) {
  super(target);

  fValue = value;
 }

 @Override
 public String getReferenceTypeName() throws DebugException {
  return "text type";
 }

 @Override
 public String getValueString() throws DebugException {
  return fValue;
 }

 @Override
 public IVariable[] getVariables() throws DebugException {
  return new IVariable[0];
 }

 @Override
 public boolean hasVariables() throws DebugException {
  return false;
 }
}
To display hierarchical structures a value might hold child variables (eg. fields of a class, elements of a collection, ...). In that case you need to implement hasVariables() and getVariables() too.

You might have noticed that both classes define a method getReferenceTypeName(). While TextVariable.getReferenceTypeName() denotes the declared variable type, TextValue.getReferenceTypeName() denotes the actual type. Looking at a java example
IValue value = new TextValue();
The declared type would be IValue, while the actual type would be TextValue. You may enable these columns in the debug view by opening the Variables view menu and selecting Layout / Select Columns...

Step 2: Updating variables

Now for the big question: "how and when to update variables".

First we notice that variables are queried by the debug framework when a StackFrame element is selected that is in suspended mode. As we should do all our debugger queries in asynchronous mode we have two options:
  1. populate all stack frames automatically with variables on a suspend event in case our user might query them
  2. first deliver outdated/no data and update them as fast as possible
For the demo I chose the second option: we display whatever variables we had stored on the last query and trigger an asynchronous update.
public class TextStackFrame extends TextDebugElement implements IStackFrame {

 private final List<TextVariable> fVariables = new ArrayList<TextVariable>();
 private boolean fDirtyVariables = true;

 @Override
 public synchronized IVariable[] getVariables() {
  if (fDirtyVariables) {
   fDirtyVariables = false;
   getDebugTarget().fireModelEvent(new FetchVariablesRequest());
  }

  return fVariables.toArray(new IVariable[fVariables.size()]);
 }

 public synchronized void setVariables(Map<String, String> variables) {
  for (String name : variables.keySet()) {
   boolean processed = false;
   // try to find existing variable
   for (TextVariable variable : fVariables) {
    if (variable.getName().equals(name)) {
     variable.setValue(variables.get(name));
     variable.fireChangeEvent(DebugEvent.CONTENT);

     processed = true;
     break;
    }
   }

   if (!processed) {
    // not found, create new variable
    TextVariable textVariable = new TextVariable(getDebugTarget(), name, variables.get(name));
    fVariables.add(textVariable);
    textVariable.fireCreationEvent();
   }
  }
 }

 @Override
 public synchronized void fireChangeEvent(int detail) {
  fDirtyVariables = true;

  super.fireChangeEvent(detail);
 }

 @Override
 public boolean hasVariables() {
  return getVariables().length > 0;
 }
}


The TextDebugger sends its list of variables as a new event to the TextDebugTarget, which simply delegates the call to the topmost StackFrame within its handleEvent() method. During the update we send either change events or creation events for the updated variables. Of course a real implementation should be more intelligent than the implemented version above and use intelligent comparisons and caching.

If you want changed contents to be highlighted you should implement IVariable.hasValueChanged(). An example implementation is provided in the source code on github.

 
UI problems

There is one behavior, I could not fix yet: Sometimes the Variables view remains empty when the debugger suspends. Pushing the view to back and bringing it to front again solves this issue. Not sure if this is a problem in my code or the debugger framework. See bug 528120 for details.

Wednesday, November 20, 2013

Debugger 8: Adding "Run to line" support

Dedicated Run to line support is quite easy to implement. Most parts are already provided by the debug framework, we only need to consume it in the right way.

Debug Framework Tutorials

For a list of all debug related tutorials see Debug Framework Tutorials Overview.

Source code for this tutorial is available on github as a single zip archive, as a Team Project Set or you can browse the files online.

Step 1: Implement editor support

To use the run to line functionality from the debug framework the source code editor needs to implement IRunToLineTarget.
package com.codeandme.textinterpreter.debugger;

public class RunToLineTarget implements IRunToLineTarget {

 @Override
 public void runToLine(IWorkbenchPart part, ISelection selection, ISuspendResume target) throws CoreException {
  if (target instanceof TextStackFrame) {
   IDebugTarget debugTarget = (IDebugTarget) ((IAdaptable) target).getAdapter(IDebugTarget.class);
   if (debugTarget instanceof TextDebugTarget) {
    IBreakpoint breakpoint = new TextRunToLineBreakpoint(((TextDebugTarget) debugTarget).getFile(), getLineNumber(selection));
    RunToLineHandler handler = new RunToLineHandler(debugTarget, target, breakpoint);
    handler.run(new NullProgressMonitor());
   }
  }
 }

 @Override
 public boolean canRunToLine(IWorkbenchPart part, ISelection selection, ISuspendResume target) {
  return (target instanceof TextStackFrame);
 }

 private static int getLineNumber(ISelection selection) {
  if (selection instanceof ITextSelection)
   // text selections are 0 based
   return ((ITextSelection) selection).getStartLine() + 1;

  return 0;
 }
}
On a runToLine() call we create a new TextRunToLineBreakpoint which the handler automatically activates. The only difference to a TextLineBreakpoint is that we set its PERSISTED flag to false.

Of course the default text editor does not implement IRunToLineTarget. Therefore we need an adapter similar to what we did for the UI breakpoint integration.

That is everything we need to code for the Run to line functionality. Easy, isn't it?

The debug framework implementation also honors the preferences setting Run/Debug / Skip breakpoints during a 'Run to Line' operation. To me it seems as the implementation might be slightly buggy though. As the demo interpreter is lightning fast, conventional breakpoints will not be disabled fast enough sometimes and might still trigger.

Step 2: Register UI integration

To add the action into the editor context menu we need to add a new org.eclipse.ui.popupMenus extension point. Add a viewerContribution to it with id set to "textEditor.editorActions" and targetID set to "#TextEditorContext". Now add the Run to line action as provided in the screenshot.

Tuesday, November 19, 2013

Debugger 7: Source lookup

Having stepping and breakpoint support is nice, but the user needs some visual feedback where the debugger currently suspended. The source code should be opened in an editor and the current line should be highlighted.

The debug framework comes with a dedicated solution that looks for source files in dedicated project folders. If you have a project setup where you define source lookup folders this is the way to go for you. Another option is to implement source lookup completely from scratch. In our case the latter option is the easier one.

Debug Framework Tutorials

For a list of all debug related tutorials see Debug Framework Tutorials Overview.

Source code for this tutorial is available on github as a single zip archive, as a Team Project Set or you can browse the files online.

Step 1: The big picture

When a debug thread starts processing, it typically calls files, methods and functions. Such elements denote the call stack. The debugger framework uses this stack to resolve the current location within the source code. Each stack element may have a dedicated source location (editor content + selection within editor) attached to it.

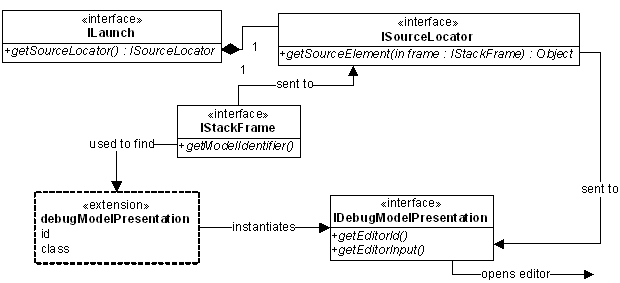
An ISourceLocator is attached to a launch extension, typically by using the org.eclipse.debug.core.sourceLocators extension point. This locator converts an IStackFrame to a source element by means of getSourceElement(IStackFrame stackFrame). This element is used to retrieve an IEditorInput and an editorID from the debug model. Now an editor can be opened. The line selection is retrieved from the stack frame.


Step 2: Adding StackFrames

The IStackFrame implementation we use is really simple: we only allow to store the current line number and to retrieve the source file. As we have only one source file available, we store it directly within our debug target.

Create a new class TextStackFrame:
public class TextStackFrame extends TextDebugElement implements IStackFrame {

 private final IThread fThread;
 private int fLineNumber = 1;

 public TextStackFrame(IDebugTarget target, IThread thread) {
  super(target);
  fThread = thread;
 }

 @Override
 public IThread getThread() {
  return fThread;
 }

 @Override
 public int getLineNumber() {
  return fLineNumber;
 }

 @Override
 public int getCharStart() {
  return -1;
 }

 @Override
 public int getCharEnd() {
  return -1;
 }

 @Override
 public String getName() {
  return getSourceFile().getName() + ", line " + getLineNumber();
 }

 public void setLineNumber(int lineNumber) {
  fLineNumber = lineNumber;
 }

 public IFile getSourceFile() {
  return (getDebugTarget()).getFile();
 }
}
For a line oriented language getLineNumber() is important as it is used for the line marker when our code is suspended. Make sure both getCharStart() and getCharEnd() return -1 in that case. If you want to mark a section within a line, implement getCharStart() and getCharEnd().

As we do not have multiple source files, function calls or similar things we can stick to one static StackFrame for the whole debugging session. It is registered and updated from the TextDebugTarget:
public class TextDebugTarget extends TextDebugElement implements IDebugTarget, IEventProcessor {

 @Override
 public void handleEvent(final IDebugEvent event) {

  if (!isDisconnected()) {

   if (event instanceof DebuggerStartedEvent) {

    [...]

    // create stack frame
    TextStackFrame stackFrame = new TextStackFrame(this, thread);
    thread.addStackFrame(stackFrame);
    stackFrame.fireCreationEvent();

   } else if (event instanceof SuspendedEvent) {
    // debugger got started and waits in suspended mode
    setState(State.SUSPENDED);

    getThreads()[0].getTopStackFrame().setLineNumber(((SuspendedEvent) event).getLineNumber());
    getThreads()[0].getTopStackFrame().fireChangeEvent(DebugEvent.CONTENT);

    // inform eclipse of suspended state
    fireSuspendEvent(DebugEvent.CLIENT_REQUEST);
   }

   [...]

  }
 }
}
It is important that the StackFrame is registered before the debug UI suspends for the first time. If this is not the case the Debug view will not fully expand all its nodes and therefore not display the suspended StackFrame and the according source file in the first place. A user would have to manually expand and select the StackFrame.

When executing you will now see a StackFrame child node for our thread, indicating the executed file and line number.

Step 3: Resolving source files

Resolving source elements is handled by a SourceLocator. We have to register a new one in com.codeandme.debugger.textinterpreter.debugger/plugin.xml:

The implementation of TextSourceLocator is straight forward, we only need to deal with getSourceElement():
public class TextSourceLocator implements IPersistableSourceLocator {

 @Override
 public Object getSourceElement(IStackFrame stackFrame) {
  if (stackFrame instanceof TextStackFrame)
   return ((TextStackFrame) stackFrame).getSourceFile();

  return null;
 }
}
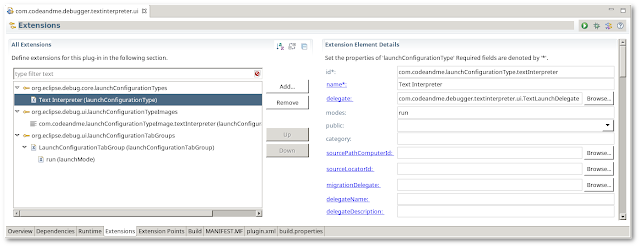
Having  a source locator we now may register it to the launch configuration. Open com.codeandme.debugger.textinterpreter.ui/plugin.xml, navigate to the Text Interpreter launchConfigurationType and set sourceLocatorId to com.codeandme.debugger.textinterpreter.debugger.sourceLocator.

Step 4: Adding editor support

The final step is to define the editor to be used. This is handled by TextDebugModelPresentation:
public class TextDebugModelPresentation implements IDebugModelPresentation {

 @Override
 public IEditorInput getEditorInput(Object element) {
  if (element instanceof IFile)
   return new FileEditorInput((IFile) element);

  return null;
 }

 @Override
 public String getEditorId(IEditorInput input, Object element) {
  if (element instanceof IFile)
   return PlatformUI.getWorkbench().getEditorRegistry().getDefaultEditor(((IFile) element).getName()).getId();

  return null;
 }
}
Using the default editor for the source file is a good choice as it is up to the user to define a dedicated editor. We might add some fallback code to open the default text editor instead of returning null in an error case.

Code lookup should work by now. Give it a try and step through some sample scripts.

Monday, November 18, 2013

Debugger 6: Debugger breakpoint integration

After we have breakpoints available in the UI we need to teach our debug model and debugger to use them.

Debug Framework Tutorials

For a list of all debug related tutorials see Debug Framework Tutorials Overview.

Source code for this tutorial is available on github as a single zip archive, as a Team Project Set or you can browse the files online.

Step 1: Adding breakpoint support to the model

Debuggers generally should suspend when a new source file is loaded. Then the model can attach breakpoints to the debugger and resume operation afterwards.

Additionally we need to listen for breakpoint changes to add new breakpoints to the debugger or to remove them when they get disabled or removed by the user.

Lets start with the listener implementation:
public class TextDebugTarget extends TextDebugElement implements IDebugTarget, IEventProcessor {

 @Override
 public boolean supportsBreakpoint(final IBreakpoint breakpoint) {
  if (fFile.equals(breakpoint.getMarker().getResource())) {
   // breakpoint on our source file
   return true;
  }

  return false;
 }

 private boolean isEnabledBreakpoint(IBreakpoint breakpoint) {
  try {
   return breakpoint.isEnabled() && DebugPlugin.getDefault().getBreakpointManager().isEnabled();
  } catch (CoreException e) {
   // ignore invalid breakpoint
  }

  return false;
 }

 // ************************************************************
 // IBreakpointListener
 // ************************************************************

 @Override
 public void breakpointAdded(final IBreakpoint breakpoint) {
  if ((supportsBreakpoint(breakpoint)) && (isEnabledBreakpoint(breakpoint)))
   fireModelEvent(new BreakpointRequest(breakpoint, BreakpointRequest.ADDED));
 }

 @Override
 public void breakpointRemoved(final IBreakpoint breakpoint, final IMarkerDelta delta) {
  if (supportsBreakpoint(breakpoint))
   fireModelEvent(new BreakpointRequest(breakpoint, BreakpointRequest.REMOVED));
 }

 @Override
 public void breakpointChanged(final IBreakpoint breakpoint, final IMarkerDelta delta) {
  breakpointRemoved(breakpoint, delta);
  breakpointAdded(breakpoint);
 }
}
As breakpoints might be targeting non relevant source files or even other target languages we need to verify that a breakpoint is related to our source file. If yes, we send an adequate event to our debugger.

While there are no further checks for a breakpoint removal, we only add active breakpoints. There exist two separate enablements we need to verify: the breakpoint itself can be disabled and/or the BreakpointManager can be disabled globally.

Next we need to take care that we track breakpoint changes accordingly by subscribing to the BreakpointManager.
public class TextDebugTarget extends TextDebugElement implements IDebugTarget, IEventProcessor {

 @Override
 public void handleEvent(final IDebugEvent event) {

  if (!isDisconnected()) {
   if (event instanceof DebuggerStartedEvent) {
    // create debug thread
    TextThread thread = new TextThread(this);
    fThreads.add(thread);
    thread.fireCreationEvent();

    // debugger got started and waits in suspended mode
    setState(State.SUSPENDED);

    // add breakpoint listener
    DebugPlugin.getDefault().getBreakpointManager().addBreakpointListener(this);

    // attach deferred breakpoints to debugger
    IBreakpoint[] breakpoints = DebugPlugin.getDefault().getBreakpointManager().getBreakpoints(getModelIdentifier());
    for (IBreakpoint breakpoint : breakpoints)
     breakpointAdded(breakpoint);

    // inform eclipse of suspended state
    fireSuspendEvent(DebugEvent.CLIENT_REQUEST);

   } else if (event instanceof TerminatedEvent) {
    // debugger is terminated
    setState(State.TERMINATED);

     // unregister breakpoint listener
     DebugPlugin.getDefault().getBreakpointManager().removeBreakpointListener(this);

    // we do not need our dispatcher anymore
    fDispatcher.terminate();

    // inform eclipse of terminated state
    fireTerminateEvent();
   }
  }
 }
}
On a DebuggerStartedEvent we need to set all relevant breakpoints. If we stay suspended or immediately call resume() is a matter of taste.

Step 2: Adding breakpoint support to the debugger

The debugger needs to cache breakpoints and check them on a line change event. In our case we will simply track line numbers where we want to suspend:
public class TextDebugger implements IDebugger, IEventProcessor {

 private final Collection<Integer> fBreakpoints = new HashSet<>();

 @Override
 public boolean isBreakpoint(final int lineNumber) {
  if (fBreakpoints.contains(lineNumber))
   return true;

  return fIsStepping;
 }

 @Override
 public void handleEvent(final IDebugEvent event) {

  [...]

  } else if (event instanceof BreakpointRequest) {
   int line = ((BreakpointRequest) event).getBreakpoint().getMarker().getAttribute(IMarker.LINE_NUMBER, -1);
   if (line != -1) {
    if (((BreakpointRequest) event).getType() == BreakpointRequest.ADDED)
     fBreakpoints.add(line);

    else if (((BreakpointRequest) event).getType() == BreakpointRequest.REMOVED)
     fBreakpoints.remove(line);
   }
  }
 }
}

Breakpoints are stored for a dedicated IDebugModelPresentation. We introduced one in the previous tutorial. Now we need to let TextDebugElement.getModelIdentifier() refer to this ID. If you do not set this identifier, you will not be able to find any breakpoints.

The mechanisms for setting and caching breakpoints might get a bit more complicated for a real world solution as you might support different kinds of breakpoints like function breakpoints or watchpoints.

Friday, November 15, 2013

Debugger 5: UI breakpoint integration

In the previous tutorial we implemented stepping through our source code. While single stepping is quite nice, we need to add breakpoint support for a better debugging experience. By the end of this tutorial we will be able to set them using the UI:

The debugger will not yet be aware of these breakpoints. This functionality will be implemented in the next tutorial. In case your editor already supports setting breakpoints, you may skip this tutorial.

In eclipse there exist different kinds of breakpoints: line breakpoints (stop execution at a certain line), function breakpoints (stop whenever function foo() is called), watchpoints (stop whenever a variable is accessed/changed) and some more. Not all of them make sense for a dedicated language. In this tutorial we will have a closer look at line breakpoints only.

Debug Framework Tutorials

For a list of all debug related tutorials see Debug Framework Tutorials Overview.

Source code for this tutorial is available on github as a single zip archive, as a Team Project Set or you can browse the files online.


Step 1: Breakpoint definition

Breakpoints are defined by the breakpoints extension point. To make such breakpoints persistent, eclipse uses markers. So each breakpoint is backed by a marker which is bound to a workspace resource.

Create a new org.eclipse.core.resource.markers extension in com.codeandme.debugger.textinterpreter.debugger/plugin.xml. The marker ID should be a single name without any plugin name qualifier before it, so set it to "textLineBreakpointMarker". The full marker name is automatically prepended with the Plug-in ID. Our marker should be a subtype of org.eclipse.debug.core.lineBreakpointMarker and persistable. Set these attributes by adding subnodes to your marker definition (see screenshot below).

Afterwards we create an org.eclipse.debug.core.breakpoints extension which refers to the marker type just created before.


The implementation is straight forward. We only add a constructor to attach a breakpoint to a resource:
public class TextLineBreakpoint extends LineBreakpoint {

 /**
  * Default constructor needed by the Eclipse debug framework. Do not remove!
  */
 public TextLineBreakpoint() {
 }

 public TextLineBreakpoint(final IResource resource, final int lineNumber) throws CoreException {
  this(resource, lineNumber, true);
 }

 protected TextLineBreakpoint(final IResource resource, final int lineNumber, final boolean persistent) throws CoreException {
  IWorkspaceRunnable runnable = new IWorkspaceRunnable() {
   @Override
   public void run(IProgressMonitor monitor) throws CoreException {
    IMarker marker = resource.createMarker(Activator.PLUGIN_ID + ".textLineBreakpointMarker");
    setMarker(marker);
    marker.setAttribute(IBreakpoint.ENABLED, true);
    marker.setAttribute(IBreakpoint.PERSISTED, persistent);
    marker.setAttribute(IMarker.LINE_NUMBER, lineNumber);
    marker.setAttribute(IBreakpoint.ID, getModelIdentifier());
    marker.setAttribute(IMarker.MESSAGE, "Line Breakpoint: " + resource.getName() + " [line: " + lineNumber + "]");
   }
  };
  run(getMarkerRule(resource), runnable);
 }

 @Override
 public String getModelIdentifier() {
  return TextDebugModelPresentation.ID;
 }
}
Make sure to keep the default constructor, as it is needed by the debug framework to restore breakpoints.

As you can see, we used a new class here: TextDebugModelPresentation. It is needed to embrace all parts of the debug model for a certain debugger type. For now it is an empty implementation of IDebugModelPresentation, only providing its ID as a static constant. Do not forget to register it as an extension in com.codeandme.debugger.textinterpreter.debugger/plugin.xml.

Step 2: Add breakpoint support to editors

Users want to set their breakpoints in the code editor. For that our editor of choice needs to implement the IToggleBreakpointsTarget interface. Unfortunately the default text editor we use does not support this interface. Therefore we need to create an adapter for the editor. The adapter pattern is out of scope of this tutorial. If you need more information on how to create adapters you may read this article.

The adapter factory creates instances of TextLineBreakpointTarget:
public class TextLineBreakpointTarget implements IToggleBreakpointsTarget {

 @Override
 public boolean canToggleLineBreakpoints(IWorkbenchPart part, ISelection selection) {
  return true;
 }

 @Override
 public void toggleLineBreakpoints(IWorkbenchPart part, ISelection selection) throws CoreException {
  ITextEditor textEditor = getEditor(part);
  if (textEditor != null) {
   IResource resource = (IResource) textEditor.getEditorInput().getAdapter(IResource.class);
   ITextSelection textSelection = (ITextSelection) selection;
   int lineNumber = textSelection.getStartLine();
   IBreakpoint[] breakpoints = DebugPlugin.getDefault().getBreakpointManager().getBreakpoints(TextDebugModelPresentation.ID);
   for (int i = 0; i < breakpoints.length; i++) {
    IBreakpoint breakpoint = breakpoints[i];
    if (resource.equals(breakpoint.getMarker().getResource())) {
     if (((ILineBreakpoint) breakpoint).getLineNumber() == (lineNumber + 1)) {
      // existing breakpoint; delete
      breakpoint.delete();
      return;
     }
    }
   }

   // new breakpoint; create
   TextLineBreakpoint lineBreakpoint = new TextLineBreakpoint(resource, lineNumber + 1);
   DebugPlugin.getDefault().getBreakpointManager().addBreakpoint(lineBreakpoint);
  }
 }
}
Similar to the step and resume commands in the previous tutorials we have to implement some canToggleBreakpoint() methods. In our case we allow for LineBreakpoints only. The toggling itself is simple:
  1. get the active editor (line 10)
  2. get the current line number from the selection (lines 13, 14)
  3. look for an existing breakpoint at that line (lines 15-25)
  4. optionally delete an existing breakpoint or create a new one (lines 21/29)
When launching your application you should be able to set breakpoints using the Run/Toggle Breakpoint entry from the main menu. This entry is available in the Debug perspective, so make sure to activate it first.

Step 3: Toggle breakpoints from the ruler context menu

To add an item to the context menu of the ruler we need to use actions. Open the plugin.xml of the debugger project and add a new org.eclipse.ui.popupMenus extension. Add a new viewerContribution to it. Set id to "textEditor.rulerActions" and targetID to "#TextRulerContext". Now add a new action with id set to "pda.editor.ruler.toggleBreakpointAction". The implementation is rather boring as it only resolves the line number of the mouse click and then uses our IToggleBreakpointsTarget from before to toggle a line breakpoint.

Toggling breakpoints now works from the ruler context menu. Note that a double click still sets bookmarks and does not toggle breakpoints.
 
Conclusion

We are now able to set breakpoints in the UI. But our debugger does not use them right now. In the next tutorial we will implement debugger support for breakpoints.

Thursday, November 14, 2013

Debugger 4: Stepping, suspending and other actions

During the previous tutorial we created the basic structure for our debugger. Today we will work on the UI integration part.

When our debugger is running, Eclipse provides different toolbar actions, depending on what selection is active in the Debug view. There are four different types of actions:
  • Terminate
  • Suspend/Resume
  • Disconnect
  • Stepping
For each of these groups exists an interface (ITerminate, ISuspendResume, IDisconnect and IStep). Whenever the selected element implements one of these interfaces the corresponding toolbar actions become available. Enablement will be handled by interface methods like canDisconnect(), canResume() ...

In this tutorial we will implement all these features step by step.

Debug Framework Tutorials

For a list of all debug related tutorials see Debug Framework Tutorials Overview.

Source code for this tutorial is available on github as a single zip archive, as a Team Project Set or you can browse the files online. 

Step 1: Suspend/Resume

Our debugger is very simple. We do not have multiple threads, so suspend/resume functionality is the same for the DebugTarget, a Thread or a StackFrame (we will look into this in another tutorial).

As suspend/resume is already implemented, we simply refactor stuff and move the ISuspendResume functionality to our base class TextDebugElement.
public abstract class TextDebugElement extends DebugElement implements ISuspendResume {
 public enum State {
  NOT_STARTED, SUSPENDED, RESUMED, TERMINATED, DISCONNECTED
 };

 private State fState = State.NOT_STARTED;

 @Override
 public TextDebugTarget getDebugTarget() {
  return (TextDebugTarget) super.getDebugTarget();
 }

 protected void setState(State state) {
  // only the DebugTarget saves the correct state.
  ((TextDebugElement) getDebugTarget()).fState = state;
 }

 protected State getState() {
  return ((TextDebugElement) getDebugTarget()).fState;
 }

 // ************************************************************
 // ISuspendResume
 // ************************************************************

 @Override
 public boolean canResume() {
  return isSuspended();
 }

 @Override
 public boolean canSuspend() {
  // we cannot interrupt our debugger once it is running
  return false;
 }

 @Override
 public boolean isSuspended() {
  return (getState() == State.SUSPENDED);
 }

 @Override
 public void resume() {
  // resume request from eclipse

  // send resume request to debugger
  getDebugTarget().fireModelEvent(new ResumeRequest());
 }

 @Override
 public void suspend() throws DebugException {
  throw new DebugException(new Status(IStatus.ERROR, "com.codeandme.textinterpreter.debugger", "suspend() not supported"));
 }
}

Some minor changes are needed to the derived classes which are not shown here.

Any action that might be triggered from a toolbar item has a canSomething() method that will be checked for button enablement (lines 26-35). Resuming is just a matter of sending a ResumeRequest to the debugger (line 47).

Moving to the base class allows any of our model implementations to use resuming. Besides we may remove some obsolete code from TextDebugTarget and TextThread.

When you run the debugger now try to select the Text Thread element in the Debug view. Previously we could not resume the thread, but only the Text DebugTarget. Now we can resume both.

Step 2: Implement terminate and disconnect support

Again we add the functionality to the base class:
public abstract class TextDebugElement extends DebugElement implements ISuspendResume, IDisconnect, ITerminate {

 // ************************************************************
 // IDisconnect
 // ************************************************************

 @Override
 public boolean canDisconnect() {
  return canTerminate();
 }

 @Override
 public void disconnect() {
  // disconnect request from eclipse

  // send disconnect request to debugger
  getDebugTarget().fireModelEvent(new DisconnectRequest());

  // debugger is detached, simulate terminate event
  getDebugTarget().handleEvent(new TerminatedEvent());
 }

 @Override
 public boolean isDisconnected() {
  return isTerminated();
 }

 // ************************************************************
 // ITerminate
 // ************************************************************

 @Override
 public boolean canTerminate() {
  return !isTerminated();
 }

 @Override
 public boolean isTerminated() {
  return (getState() == State.TERMINATED);
 }

 @Override
 public void terminate() {
  // terminate request from eclipse

  // send terminate request to debugger
  getDebugTarget().fireModelEvent(new TerminateRequest());
 }
}
While terminate() will immediately stop the debug session (along with the interpreter), disconnect() will only detach the eclipse debugger, but resume the interpreter. Therefore we need to extend TextDebugger.handleEvent():
 public void handleEvent(final IDebugEvent event) {
  if (event instanceof ResumeRequest)
   fInterpreter.resume();

  else if (event instanceof TerminateRequest)
   fInterpreter.terminate();

  else if (event instanceof DisconnectRequest) {
   fInterpreter.setDebugger(null);
   fInterpreter.resume();
  }
 }
On a disconnect we remove the debugger instance and resume. This allows our interpreter to continue execution without triggering further debug events.

Whether disconnect support shall be implemented or not depends on the debugger type. The default Java debugger in Eclipse does not provide disconnect support.

Step 3: Stepping support

Now for the interesting stuff: implement stepping.

Our fictional language is so simple, that it cannot support step into or step return. So what remains is step over. Functionality for all three step types would be very similar anyhow. The only difference is made in your debugger implementation that needs to know when to suspend next. As before we implement the functionality in the base class.
public abstract class TextDebugElement extends DebugElement implements ISuspendResume, IDisconnect, ITerminate, IStep {

 public enum State {
  NOT_STARTED, SUSPENDED, RESUMED, TERMINATED, DISCONNECTED, STEPPING
 };

 // ************************************************************
 // IStep
 // ************************************************************

 @Override
 public boolean canStepInto() {
  return false;
 }

 @Override
 public boolean canStepOver() {
  return isSuspended();
 }

 @Override
 public boolean canStepReturn() {
  return false;
 }

 @Override
 public boolean isStepping() {
  return (getState() == State.STEPPING);
 }

 @Override
 public void stepInto() throws DebugException {
  throw new DebugException(new Status(IStatus.ERROR, "com.codeandme.textinterpreter.debugger", "stepInto() not supported"));
 }

 @Override
 public void stepOver() {
  // stepOver request from eclipse

  // send stepOver request to debugger
  getDebugTarget().fireModelEvent(new ResumeRequest(ResumeRequest.STEP_OVER));
 }

 @Override
 public void stepReturn() throws DebugException {
  throw new DebugException(new Status(IStatus.ERROR, "com.codeandme.textinterpreter.debugger", "stepReturn() not supported"));
 }
}
This will enable the Step over toolbar button when the debugger is suspended.

The debug framework in Eclipse distinguishes between resuming and stepping. Therefore we added a new debugger state: STEPPING.

Next step is to update the TextDebugger class to keep track of the resume type (continue, step over, step into, step return):
public class TextDebugger implements IDebugger, IEventProcessor {

 private boolean fIsStepping = false;

 @Override
 public void resumed() {
  fireEvent(new ResumedEvent(fIsStepping ? ResumedEvent.STEPPING : ResumedEvent.CONTINUE));
 }

 @Override
 public boolean isBreakpoint(final int lineNumber) {
  return fIsStepping;
 }

 @Override
 public void handleEvent(final IDebugEvent event) {
  if (Activator.getDefault().isDebugging())
   System.out.println("Debugger  : process " + event);

  if (event instanceof ResumeRequest) {
   fIsStepping = (((ResumeRequest) event).getType() == ResumeRequest.STEP_OVER);
   fInterpreter.resume();

  } else if (event instanceof TerminateRequest)
   fInterpreter.terminate();

  else if (event instanceof DisconnectRequest) {
   fInterpreter.setDebugger(null);
   fInterpreter.resume();
  }
 }
}
Currently isBreakpoint() is called for each executed line. We use the fIsStepping marker to break after a step over event.

Finally the TextDebugTarget needs to fire an adequate event for the debug framework:
public class TextDebugTarget extends TextDebugElement implements IDebugTarget, IEventProcessor {

 @Override
 public void handleEvent(final IDebugEvent event) {

  if (!isDisconnected()) {

   [...]

   } else if (event instanceof ResumedEvent) {
    if (((ResumedEvent) event).getType() == ResumedEvent.STEPPING) {
     setState(State.STEPPING);
     fireResumeEvent(DebugEvent.STEP_OVER);

    } else {
     setState(State.RESUMED);
     fireResumeEvent(DebugEvent.UNSPECIFIED);
    }
   }

   [...]

  }
 }
}
By now you should be able to run the debugger in single step mode. To verify results watch the sysout output in the console.

Monday, November 11, 2013

Debugger 2: The launch framework (not only for debuggers)

In the previous tutorial we created a simple interpreter for a fictional programming language. Now we will add launch support for such scripts. We still will not be debugging yet, but launching is mandatory before we can start a debug session. So be patient, these are the last preparations we need to take.

If launching is something you are already familiar with, you might still want to check out the TextLaunchDelegate implementation, as it provides a convenient multi-purpose launcher.

Debug Framework Tutorials

For a list of all debug related tutorials see Debug Framework Tutorials Overview.

Source code for this tutorial is available on github as a single zip archive, as a Team Project Set or you can browse the files online. 

Launching

Eclipse provides two ways of launching: you may use a LaunchDelegate or a contextual LaunchShortcut. If your launch is about resources in your workspace you will quite probably implement both methods. After this tutorial we should have launch support for our interpreter.


Step 1: Launch Delegates

Create a new Plug-in Project called com.codeandme.debug.textinterpreter.ui. Switch to the Extensions tab and Add... a new launchConfigurationTypes extension. Provide a unique id and a name. The delegate class implements launch instructions, eg. creating and starting an interpreter. We will look at the implementation a bit later. Finally define the modes this LaunchConfiguration applies to. You may provide "run" and/or "debug" as a comma separated list.

Next add a launchConfigurationTypeImages extension to provide a nice icon for our LaunchConfiguration. The configTypeID needs to match the ID we provided for our launchConfigurationType before. Not much we can do wrong here.

Finally create a launchConfigurationTabGroups extension to provide the tabs to be visible when we open the Run Configurations... dialog. The class implementation is really simple as we only need to set an array of available tabs:
package com.codeandme.debugger.textinterpreter.ui.tabs;

import org.eclipse.debug.ui.AbstractLaunchConfigurationTabGroup;
import org.eclipse.debug.ui.CommonTab;
import org.eclipse.debug.ui.ILaunchConfigurationDialog;
import org.eclipse.debug.ui.ILaunchConfigurationTab;

public class LaunchConfigurationTabGroup extends AbstractLaunchConfigurationTabGroup {

    @Override
    public void createTabs(final ILaunchConfigurationDialog dialog, final String mode) {
        setTabs(new ILaunchConfigurationTab[] { new MainTab(new String[] { "txt" }), new CommonTab() });
    }
}
MainTab is a custom class that lets the user select a project and a file from the workspace. As this is pure UI programming I leave it to you to examine the implementation.

More interesting is the launchMode you may add to the launchConfigurationTabGroup: for one you can provide the mode, which means you may have different  tabs for "run" and "debug". The perspective property allows to set a default perspective when the launch is activated. In debug mode you will typically want to switch to the debug perspective. Right now we will just provide the "run" launchMode.

Step 2: Launch Shortcuts

Launch shortcuts are displayed in the context menu of workspace files and editors. They can be used to quickly launch a file without creating a LaunchConfiguration first.

The launchShortcuts extensions is very similar to the LaunchDelegates we had before. We have modes, an icon and an implementing class. With a contextualLaunch we may provide an enablement. In our case we expect that only one file is selected and its file extension matches "txt".

As we already defined a LaunchConfiguationType before, we may add it to the shortcut by providing a configurationType child node.


Step 3: Launcher implementation

We did not investigate the launcher classes for both launch types yet. As LaunchDelegates and LaunchShortcuts are very similar, I decided to implement both of them in a single class TextLaunchDelegate:
package com.codeandme.debugger.textinterpreter.ui;

public class TextLaunchDelegate implements ILaunchShortcut, ILaunchShortcut2, ILaunchConfigurationDelegate {

 @Override
 public void launch(final ILaunchConfiguration configuration, final String mode, final ILaunch launch, final IProgressMonitor monitor) throws CoreException {
  IFile file = getSourceFile(configuration);
  if (file != null) {
   // we have a valid script, lets feed it to the script engine
   launch(file, configuration, mode, launch, monitor);
  }
 }

 private void launch(final IResource file, final String mode) {

  if (file instanceof IFile) {
   // try to save dirty editors
   PlatformUI.getWorkbench().getActiveWorkbenchWindow().getActivePage().saveAllEditors(true);

   try {
    ILaunchConfiguration[] configurations = getLaunchConfgurations(file);
    if (configurations.length == 0) {
     // no configuration found, create new one
     ILaunchManager manager = DebugPlugin.getDefault().getLaunchManager();
     ILaunchConfigurationType type = manager.getLaunchConfigurationType(TextLaunchConstants.LAUNCH_CONFIGURATION_TYPE_ID);

     ILaunchConfigurationWorkingCopy configuration = type.newInstance(null, file.getName());
     configuration.setAttribute(TextLaunchConstants.PROJECT, file.getProject().getName());
     configuration.setAttribute(TextLaunchConstants.FILE_LOCATION, file.getProjectRelativePath().toPortableString());

     // save and return new configuration
     configuration.doSave();

     configurations = new ILaunchConfiguration[] { configuration };
    }

    // launch
    configurations[0].launch(mode, new NullProgressMonitor());

   } catch (CoreException e) {
    // could not create launch configuration, run file directly
    launch((IFile) file, null, mode, null, new NullProgressMonitor());
   }
  }
 }

 private void launch(final IFile file, final ILaunchConfiguration configuration, final String mode, final ILaunch launch, final IProgressMonitor monitor) {
  // create new interpreter
  TextInterpreter interpreter = new TextInterpreter();

  try {
   interpreter.setCode(toString(file));
   interpreter.schedule();

  } catch (Exception e) {
   // TODO handle this exception (but for now, at least know it
   // happened)
   throw new RuntimeException(e);
  }
 }
}
The main intention here is: no matter how our launch was triggered, try to find/create a valid launch configuration and launch that configuration. This is fairly easy for ILaunchConfigurationDelegate.launch(...) as we already get a valid configuration in the parameters list.

ILaunchShortcut.launch() provides an editor or a selection. In that case we extract the resource file to execute. Afterwards we parse all launch configurations and compare their source file with our resource (line 21). The first existing configuration with a matching source file gets executed (line 38). If no matching configuration exists, we create (and store) a new one (lines 22 - 35).

This matches quite closely the behavior of Java LaunchShortcuts: after such a launch you will find a ready to use LaunchConfiguration.

Optional: Dependencies for Launch Shortcuts

When you are running your own RCP and do not have JDT bundled with your product you might encounter a problem where Run As.../Debug As... context menu entries vanish in the navigator views after using them once. While we wait for bug 415317 to be fixed, you might add org.eclipse.jdt.ui and org.eclipse.jdt.debug.ui plug-ins to your product as a workaround.


Optional: Add Run as... / Debug as... toolbar entries to perspective

Eclipse provides nice run/debug toolbar buttons every Eclipse user knows. If you are using a custom perspective, these entries might not be visible.

To enable them add a perspectiveExtensions extension to your plugin.xml. Define the targetId (which is the id of a perspective) to alter (use * as a wildcard pattern) and provide an actionSet child node pointing its id to "org.eclipse.debug.ui.launchActionSet".